Geological Processes And Landforms
World reference maps for climate, biomes, and geography coursework.
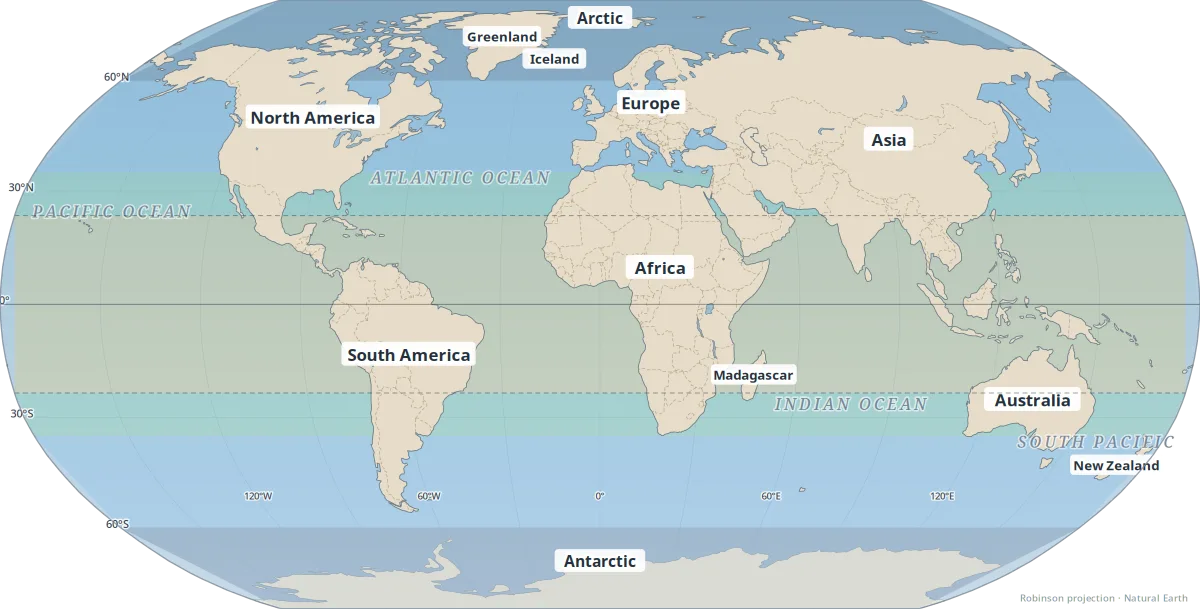
Latitude bands and major climate patterns.
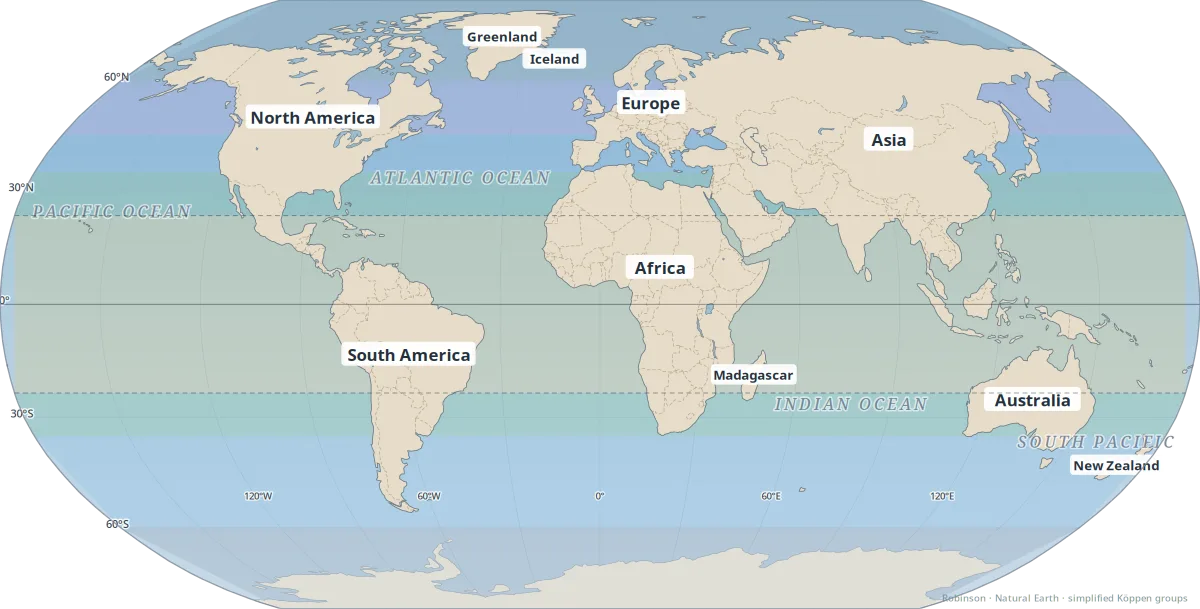
Simplified Köppen–Geiger climate types at world scale.
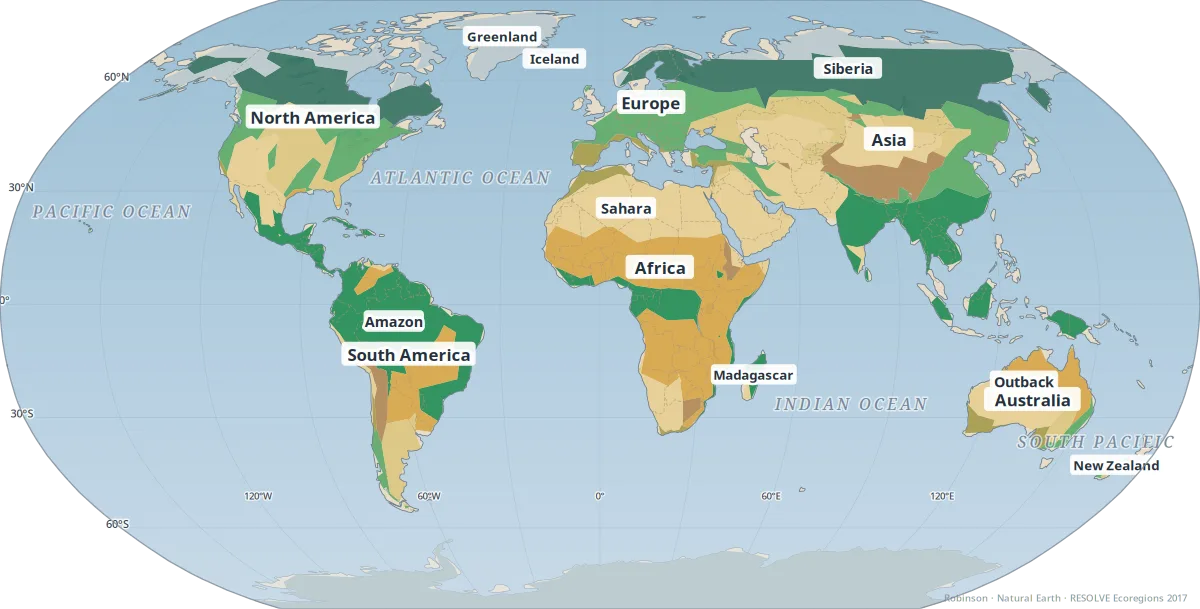
Major terrestrial biomes from tropical rainforest to tundra.
Browse all maps →
Explore guides and deep dives across our most-read categories.
View all articles →
Get new guides and stories — no spam.